
Direct
Feed
www.insideoutdoor.comFloorSpace
BackOffice
FloorSpace
BackOffice
Outdoor
Textile
Green
Glossary
Retail
Report
Outdoor
Textile
Green
Glossary
Retail
Report
www.insideoutdoor.comProducts
Section
www.insideoutdoor.comProducts
Section
Inside
Outdoor
|
Spring
2016
52
“If the
customer
isn’t happy,
they probably aren’t comingback.”
Let’s be honest, who really
likes returns? As retailers, you
are in the business of selling
merchandise, not taking it back,
right? After all, returns take
time and generally mean the
customer had a negative experi-
ence with the merchandise or
simply had a change of heart,
and now their problem is soon
going to become your problem.
Full disclosure here, that used
to be my mindset. I dreaded see-
ing our bags coming back into
the store. My hunch is that a lot
of you may feel the same way.
During the years, returns
of retail sales have steadily in-
creased, with 9 percent of retail
sales being returned, according
to the Kurt Salmon consulting
firm. The latest figures available
suggest that returns in 2014
hit $284 billion, up 6.2 percent
from the previous year. Some
attribute this increase to online
shopping since one-third of on-
line purchases come back.
I decided to poll a cross-
section of retailers that I consult
with to find out what their return
policies are. I wasn’t terribly
surprised with what I learned.
It appears that the smaller the
volume a store does, the stricter
their return policy is. The general
consensus being that smaller
retailers feel they simply can’t
afford a more liberal policy, thus
opting for store credits in lieu of
cash refunds and a tighter win-
dow in which returns are accept-
ed. Larger volume operations,
on the other hand, approach
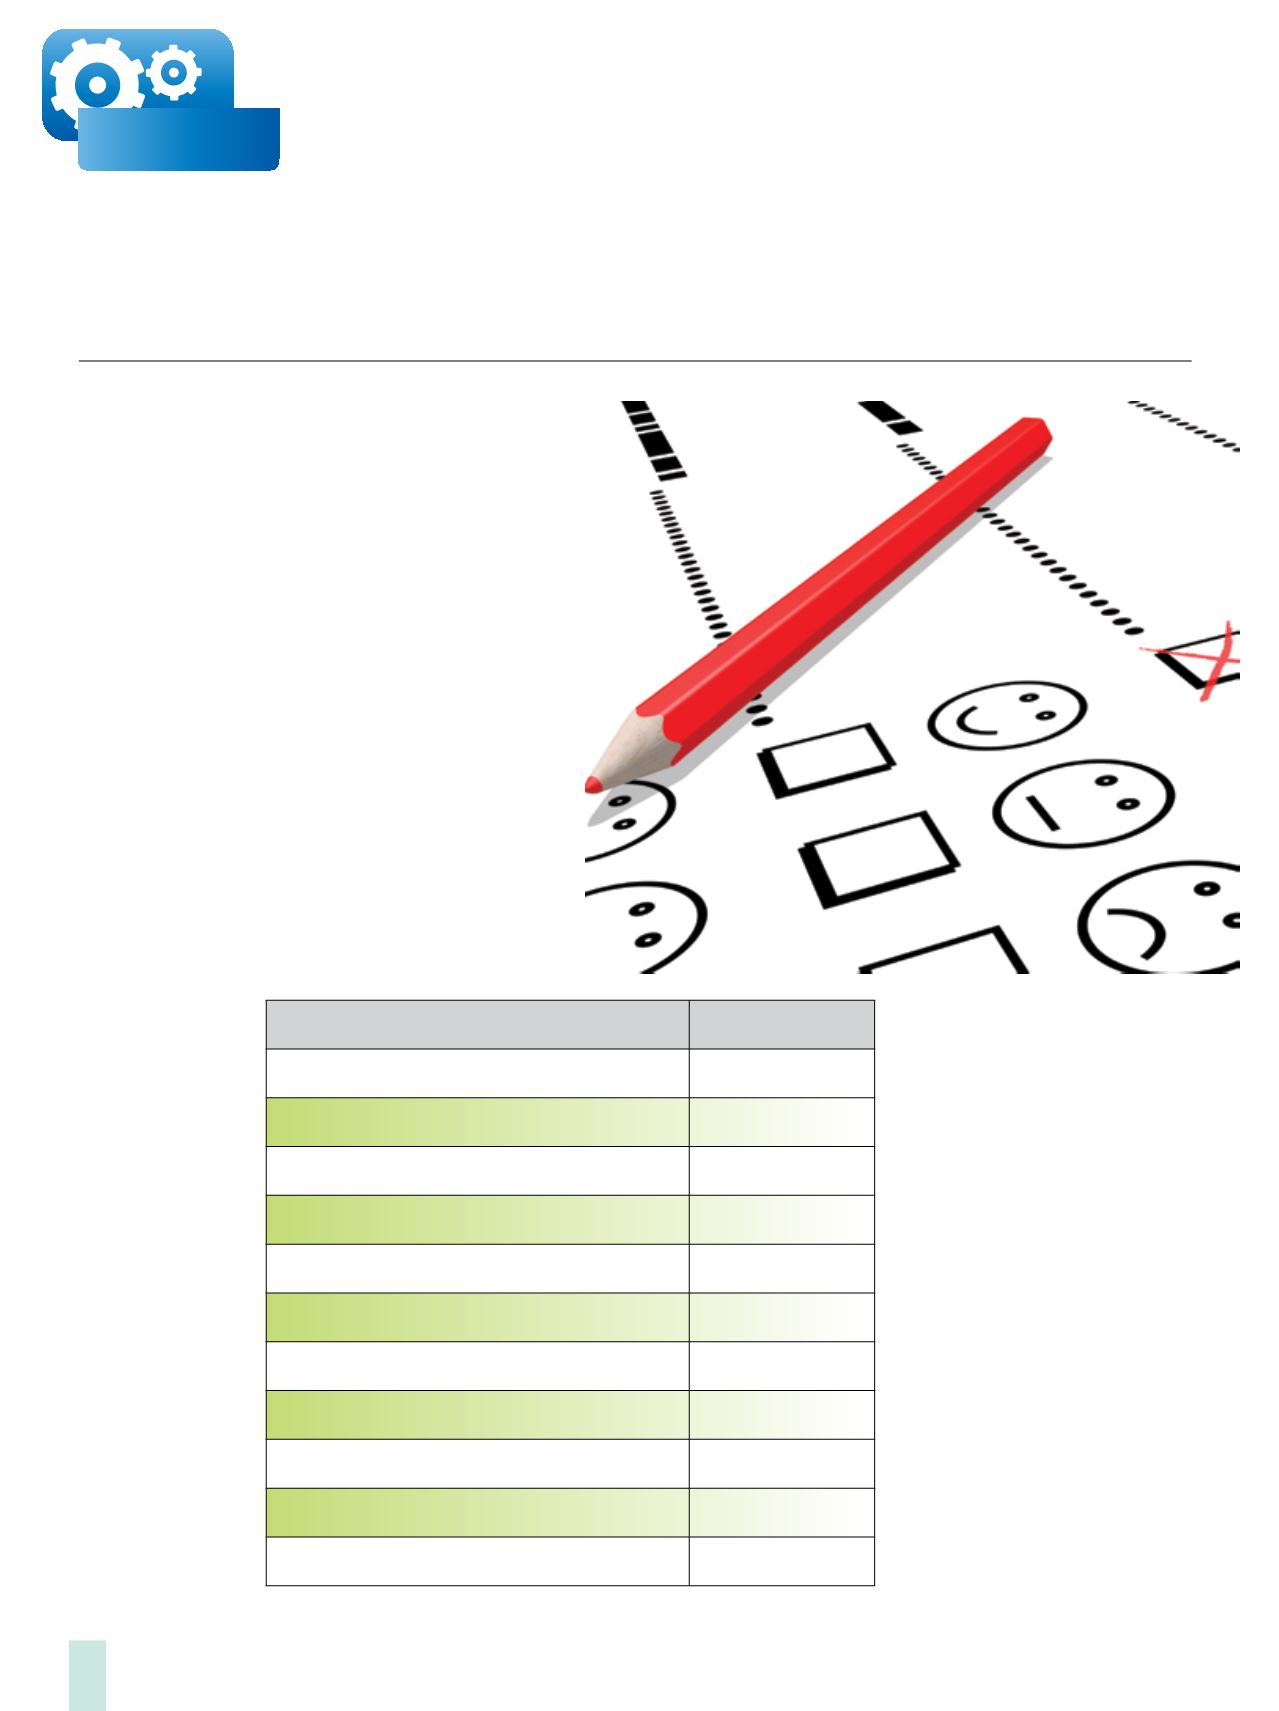
Is Your Return Policy Hurting
Your Business?
By Ritchle
Sayner
Leading Cause of Retail Returns
Reason
Global $$
1. Defective/poor quality
$162 billion
2. Bought wrong item
$99.3 billion
3. Buyer’s remorse
$88.7 billion
4. Better price elsewhere
$83.4 billion
5. Gift returns
$64.1 billion
6. Wrong sizing on item
$62.4 billion
7. Return fraud
$28.2 billion
8. Didn’t match online description
$6.1 billion
9. Late delivery of items
$4.6 billion
10. All other reasons
$43.8 billion
Total
$642.6 billion
Source: IHL Group


