


 14 / 76

Starting with the good news,
overall inactivity levels among
Americans dropped in 2015,
according to the latest findings
on the matter from the Physi-
cal Activity Council, going from
82.7 million people described
as inactive in 2014 to 81.6 mil-
lion the following year. While
these rates have fluctuated
during the last five or so years,
the 0.6 percent decrease in “in-
activity” (defined here to include
those who reported no physical
activity that year, including no
involvement in an additional
18 sports/fitness activities that
require minimal to no physi-
cal exertion), it was the largest
drop since 2010.
In other words, 1.2 million
people who were inactive in
2014 participated in some sort
of activity in 2015, show PAC’s
findings from more than 32,600
online interviews conducted
in 2016, the most gain of ac-
tive people during the last five
years. In turn, participation in
sports, fitness and related physi-
cal activities increased slightly
in 2015, with 56 percent of the
population ages 6 years and
over participating in at least one
high-caloric-burning activity. In
the few prior PAC reports, par-
ticipation to a healthy level in
high-calorie activity has been on
the decline, dropping an aver-
age of 0.6 percent.
Nonetheless, the 1.2 mil-
lion additional active people in
2015 doesn’t make up for half
of the Americans who became
inactive in 2014 (2.6 million
from 2013). And despite the
improvement, just more than
27 percent of American 6 years
and older reported no activity
during the course of the year.
So there are still 81.6 million
inactive Americans.
Beyond a flat out lack of
interest, several surveys have
shown that a lack of time, over-
crowded schedules, too much
work and the like are typically
chief barriers to getting outside
and getting active among non-
participants. Of course, not
enough time or too much work
are often just excuses among
those who simply lack interest
in active or outdoor pursuits.
Among the “inactives” who
do express an interest, or those
categorized as “aspirational” par-
ticipants by PAC, a different sce-
nario emerges. “Over the last two
years, the aspirational participant
reports that having someone to
take part in an activity with would
be the big push to get them in-
volved,” said the PAC study.
“Over the last
two years, the
aspirational
participant
reports
that having
someone to
take part in
an activity
with would be
the big push
to get them
involved.”
By
Martin
Vilaboy
Buddy Systems
Partners may be a key to new participation
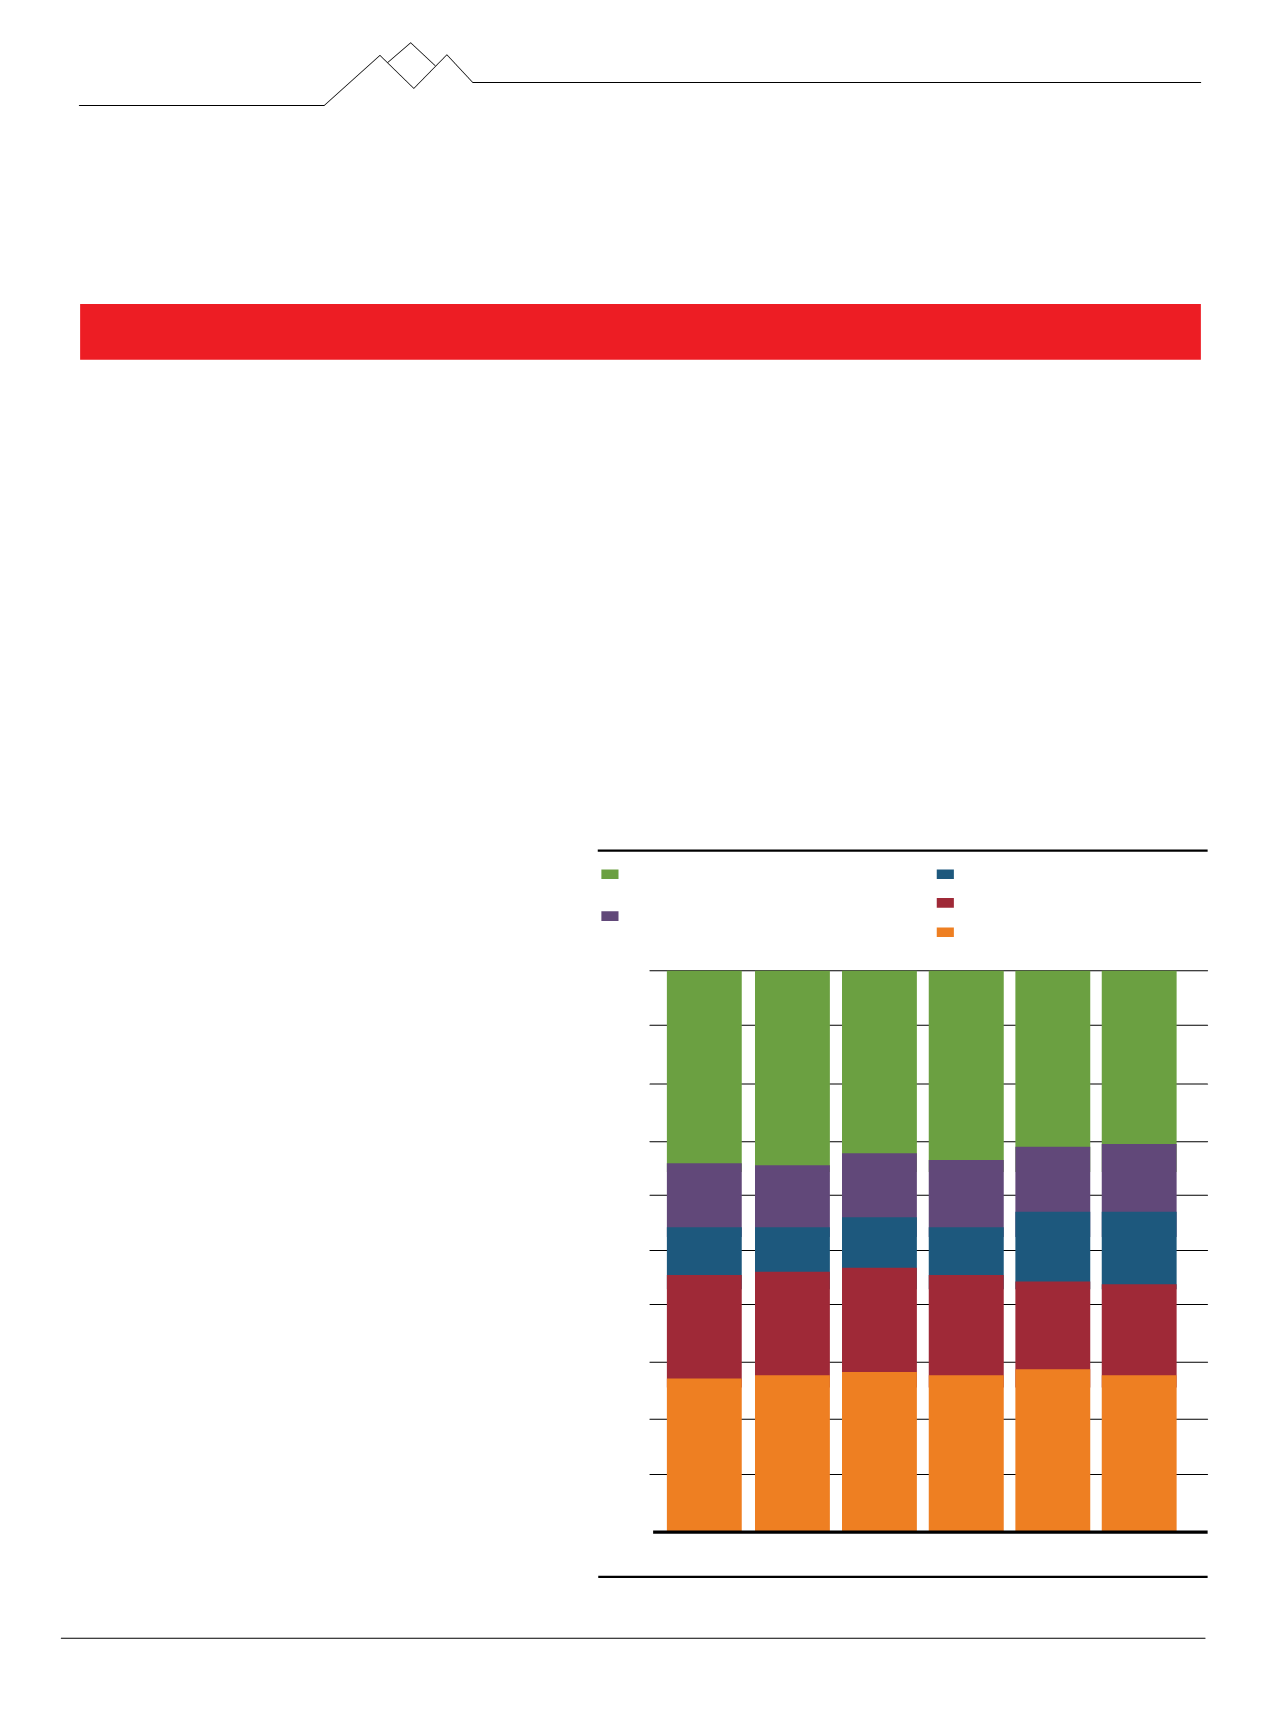
FLOOR
SPACE
Inactive to Healthy Active Across Five Years
Source: Physical Activity Council
Active to a Healthy Level and Beyond (151+ times)
High Calorie Activity
Active (51-150 times) High Calorie Activity
Casual (1-50 times) High Calorie Activity
Low to Med Calorie Activities
None (Inactive)
2010 2011 2012 2013
2014 2015
34.5%
11.5%
8.4%
18.8%
26.9% 27.6% 28.0% 27.6% 28.3% 27.6%
18.4% 18.6% 17.7% 15.8% 16.1%
8.2%
11.3%
9.3%
11.2%
8.9%
11.9%
12.6%
11.8%
12.8%
11.9%
34.5% 32.9% 33.9% 31.5% 31.2%
0%
10%
20%
30%
40%
50%
60%
70%
80%
90%
100%
% of Individuals Ages 6+
Inside
Outdoor
|
SUMMER
2017
14