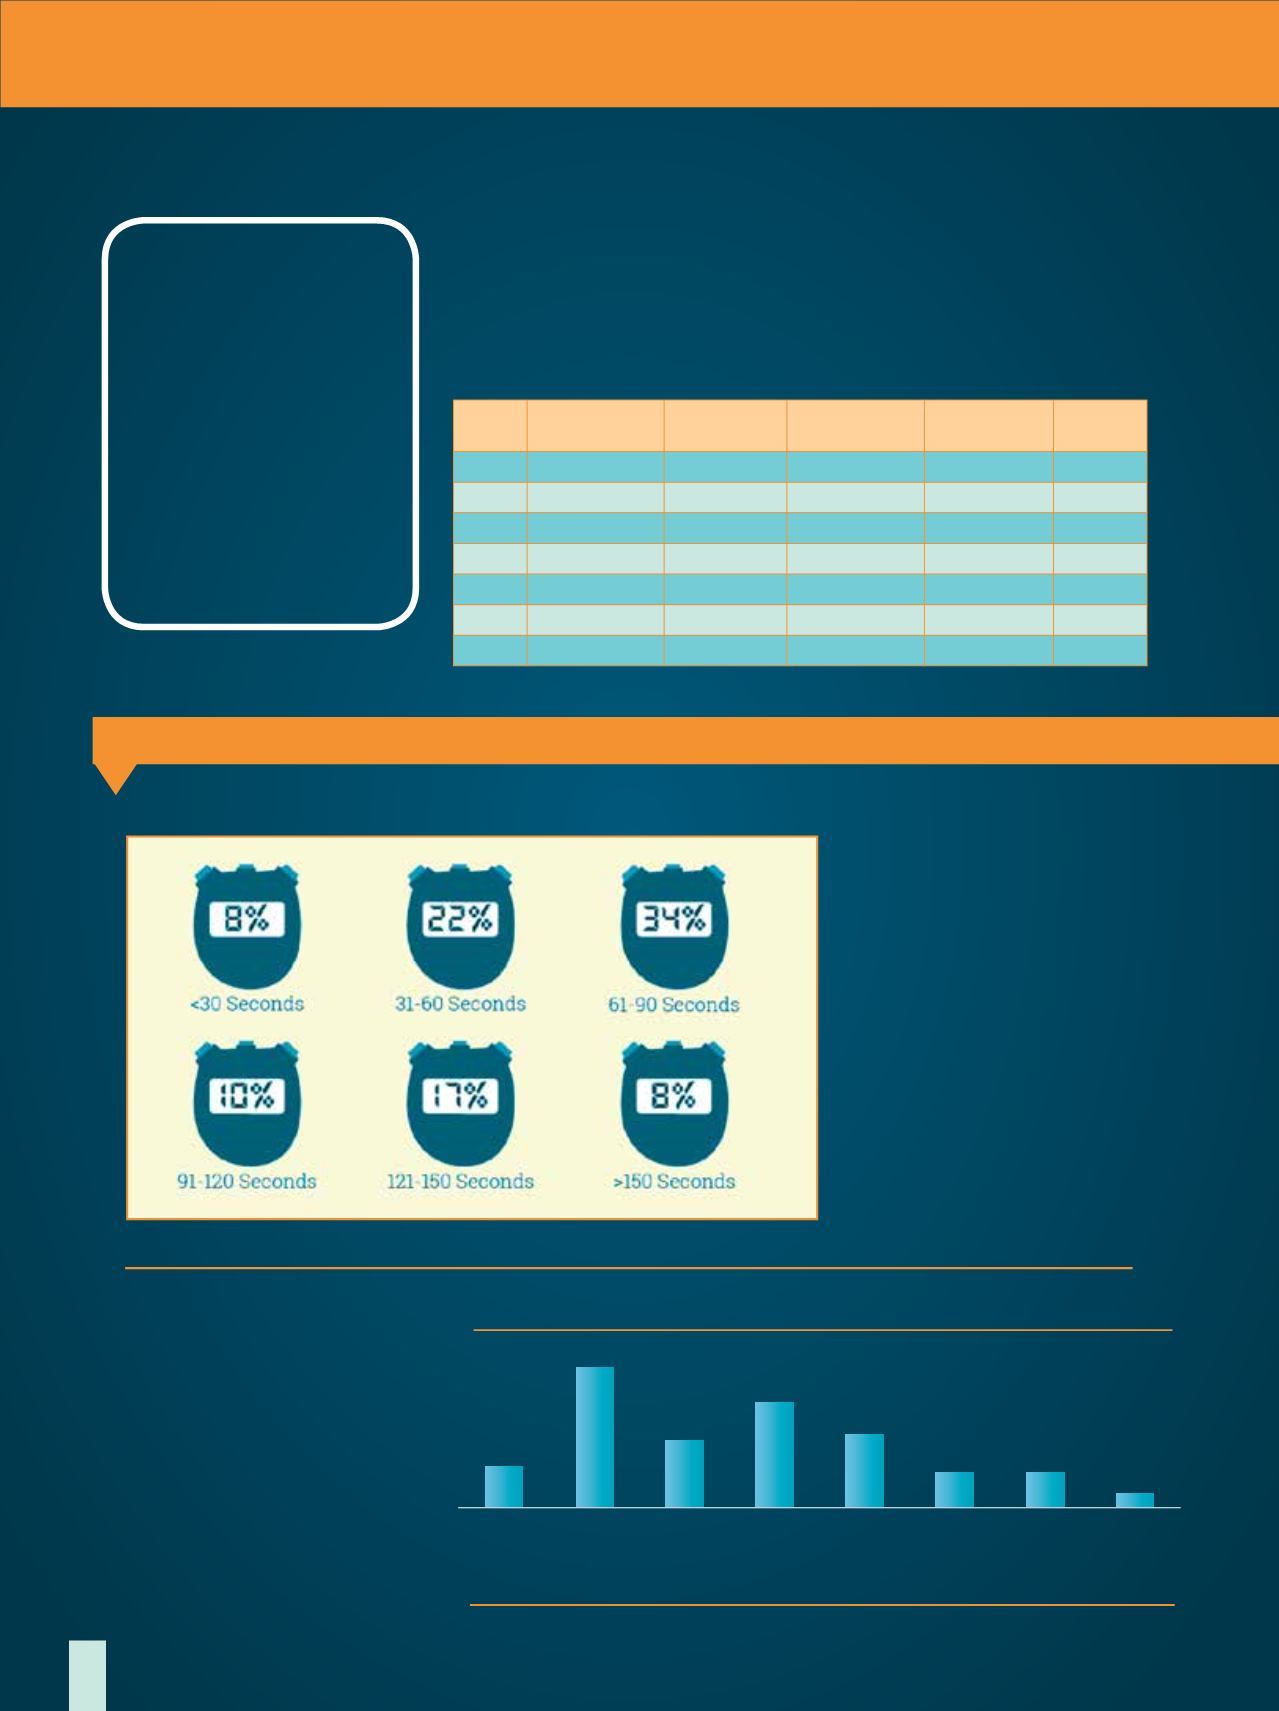

Source: Gear Cut analysis
DATA POINT
Time for Video
Generally speaking, as the re-
tail price of a product goes up,
so does the length of the demo
video. Still, a large percentage
of outdoor product videos are
somewhere between 31 and 90
seconds long, and 81 percent
are less than two minutes in
length, according to Gear Cuts,
a video production company
based in Durango.
IoT and the ROI
Retailers have high awareness
of and expectations for retail IoT
(Internet of Things), says RSR
researchers, even if the ROI is
cloudy. More than a quarter sur-
veyed say they don’t need an ROI
as long as it keeps them competi-
tive, and 40 percent say an ROI
of 2.9 percent or less is sufficient.
We’ll see if retail CFO-types feel
the same way.
Source: U.S. Fish and Wildlife Service and U.S. Census Bureau
Nike
1.7%
CamelBack
6.3%
UltraSpire
6.3%
Salomon
21.3%
Nike
5.2%
Mountain
Hardwear
6.9%
UltraSpire
8.6%
Nathan
17.2%
Nathan
23%
15
10
5
4
3 3
18
Ultimate
Direction
37.4%
Salomon
25.9%
Ultimate
Direction
31%
Pack Brand - All Finishers
Percent of U.S. PopulationWho Fished by Residence
(Total U.S. population that fished: 14 percent)
Source: Retail Systems Research
ROI Requirements for loT Investment
Pack Brand - Sub 24 Finishers
Large MSA
(1,000,000 or more)
Medium MSA
(250,000 to 999,999)
Small MSA
(50,000 to 249,999)
It’s not
about ROI,
it’s about
capital outlay
It’s not
about ROI,
it’s about
doing things
that keep
us competitive
An ROI of
0%-2.9%
An ROI of
3%-4.9%
An ROI of
5%-7.4%
An ROI of
7.5%-9.9%
An ROI of
10%-15%
An ROI
greater than
15%
Outside MSA
10%
15%
8%
27%
13%
21%
14%
7% 7%
3%
20%
24%
11
5
65
40
37
11
Source: WSER Runner Survey;
ultralive.netConsumer Wearable Device Market Shares
Vendor 3Q15
Shipments (M)
3Q15 Market
Share
3Q14
Shipments (M)
3Q14 Market
Share
Y-o-Y
Charge
Fitbit
4.7
22.2%
2.3
32.8%
101.7%
Apple 3.9
18 6%0.0
0.0%
NA
Xiaomi
3.7
17.4%
0.4
5.7%
815.4%
Garmin 0.9
4.1%
0.5
7.0%
72.5%
BBK
0.7
3.1%
0.0
0.0%
NA
Others 7.3
34.6%
3.9
54.6%
88.8%
Total
21
100%
7.1
100%
197.6%
Source: IDC
Watching FitnessTrackers
Despite the growth of smartwatches, interest in fitness trackers has not fallen,
say researchers at IDC. By the end of 3Q15, shipment volumes for both prod-
uct categories increased sequentially and year over year. However, Apple’s
rise in wearables market share (from zero to second place in one year) is cause
for alarm to all other brands and retailers in this sector.
17
Percent decrease in the number
of American consumers visit-
ing a bike shop from 2012 to
2014. The number who visit-
ed a bike shop but purchased
a bicycle from a discount/
mass merchant increased by
117 percent, says Gluskin
Townley Group.
Percentage of Videos by Length
Inside
Outdoor
|
Winter
2016
10


