


 8 / 48

Numbers Worth Noting
DATA POINTS
By
Martin
Vilaboy
Where it’s Made
According to a March ReportLinker survey of some 500 U.S. online
respondents, a majority of Americans (57%) at least say they are willing
to pay more for “Made in the USA” products. A Full 80% of those who
are willing to pay extra say they’re willing to absorb a 15% premium, and
more than half of respondents said they’d spend 30% more for electron-
ics made in the USA.
Aspirational Outings
Camping is a top “aspirational activity” among non-participants in the U.S. ,
particularly among younger non-participant age groups, according to research
by the Physical Activity Council, “showing that more Americans are interested
in getting outside and being in natural settings,” said the organization. Other
leading aspirational activities include bicycling and swimming for fitness.
Top 3 Aspirational Activities among U.S. Non-Participants
Ages 6-12
Ages 13-17
Ages 18-24
Ages 25-34
1
Camping
Camping
Camping
Swim for fitness
2
Swim for fitness
Swim for fitness
Bicycling
Camping
3
Bicycling
Bicycling
Swim for fitness
Bicycling
Ages 35-44 Ages 45-54
Ages 55-64
Ages 65+
1
Camping
Camping
Bicycling
Bird/Wildlife watching
2
Swim for fitness
Swim for fitness
Swim for fitness
Swim for fitness
3
Bicycling
Bicycling
Camping
Work out w/machines
Source: Physical Activity Council
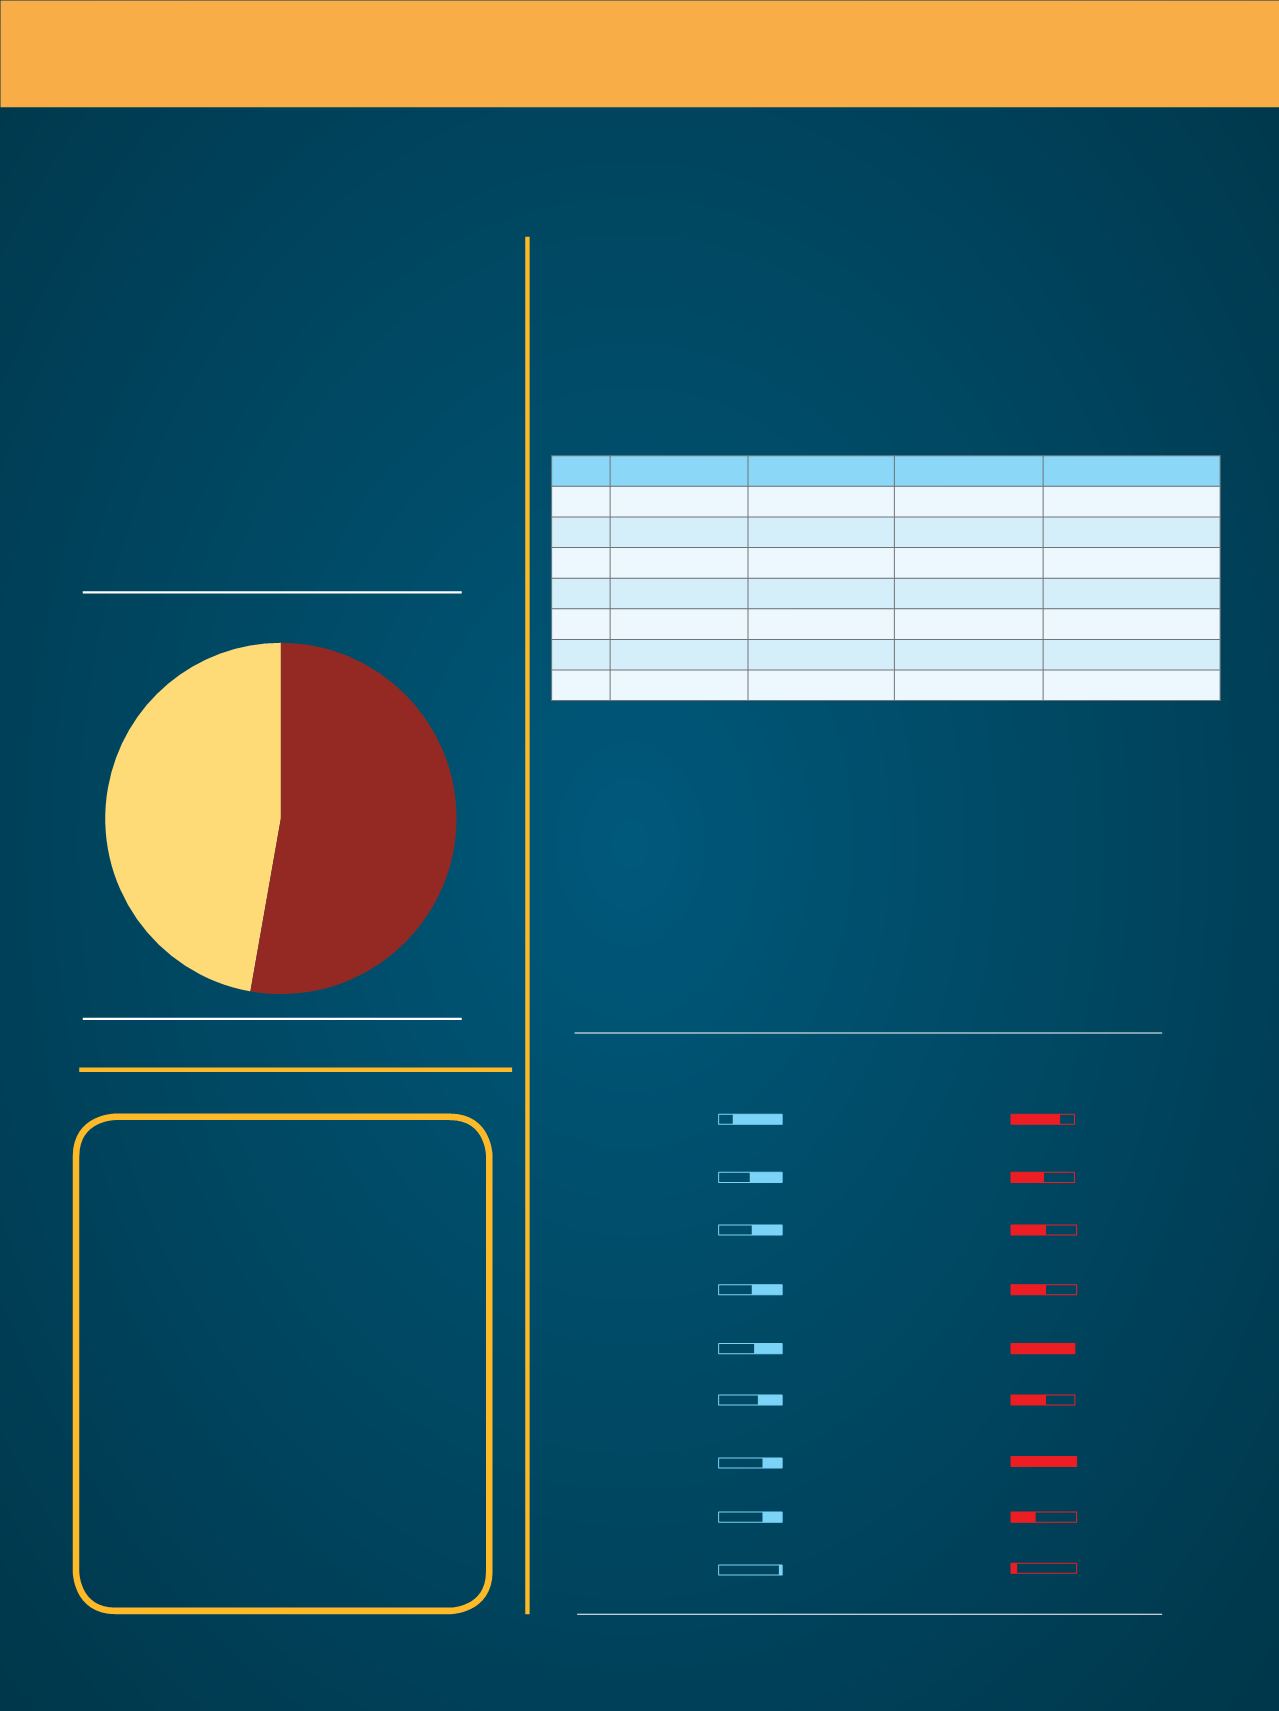
Amazonian Challenge
Just how big of a competitive threat is Ama-
zon moving forward? Could be even bigger than
you thought. According to the market view of
Slice Intelligence, Amazon grabbed 53% of all
growth in retail ecommerce sales in 2016. Ac-
cording to U.S. Census estimates, total e-
commerce sales for 2016 were $394.9 billion, an
increase of 15.1% from 2015.
Source: Slice Intelligence
Share of Retail Ecommerce Sales
Growth, Amazon vs.
Rest of the Market, 2016
% of total retail ecommerce sales growth
Mountain
biking
watching
Running/
trail running
Hunting
Backpacking
Kayaking
Canoeing
6%
1%
0%
3%
4%
4%
3%
5%
4%
2%
1%
4%
4%
2%
4%
0%
2%
2%
2%
0%
2%
2%
3%
0%
1%
3%
3%
rce: KOA
Rest of
the market
47%
Amazon
53%
“For which category of products in the
list below...
Source: ReportLinker
76%
50%
48%
48%
44%
38%
32%
29%
2%
76%
49%
51%
51%
42%
52%
42%
34%
7%
Food
Cars
Beauty and
personal care
Clothes
Electronics
Tools
Furniture
Handbags and
accessories
None of the
above
...are you the most attentive
to its origin of manufacture?
...do you prefer
buying American?
81% of older generations
62% of female respondents
65% of female respondents
58% of older generations
8.9
Year-over-year percent increase of
online fraud, with apparel retailers
and food delivery businesses
hit the hardest, according to a
study by the New Forter-Merchant
Research Council, which believes
EMV chips in credit cards are
pushing fraud online.
Inside
Outdoor
|
Spring
2017
8