


 8 / 48

Numbers Worth Noting
DATA POINTS
By
Martin
Vilaboy
to which US Social
t Likely to Turn for
as/Inspiration
s
Holiday 2015 Sales
5% 10% 15% 20% 25%
Future Health and Fitness Monitor Buying
37.9%
31.6%
18.8%
15%
10%
5%
9.3%
7.0%
5.6%
6.8%
4.9%
6.3%
4.5%
0%
Jan
2015
Apr
2015
Percentage of Respondents Who Plan on Buying a Health and Fitness Monitor in the Future
% of respondents
Jul
2015
Oct
2015
Jan
2016
Apr
2016
Jul
2016
Source: 451 Research
US Millennial Internet UsersWho Use
an Ad Blocker, by Device, July 2016
Source: Anatomy Media
% of respondents
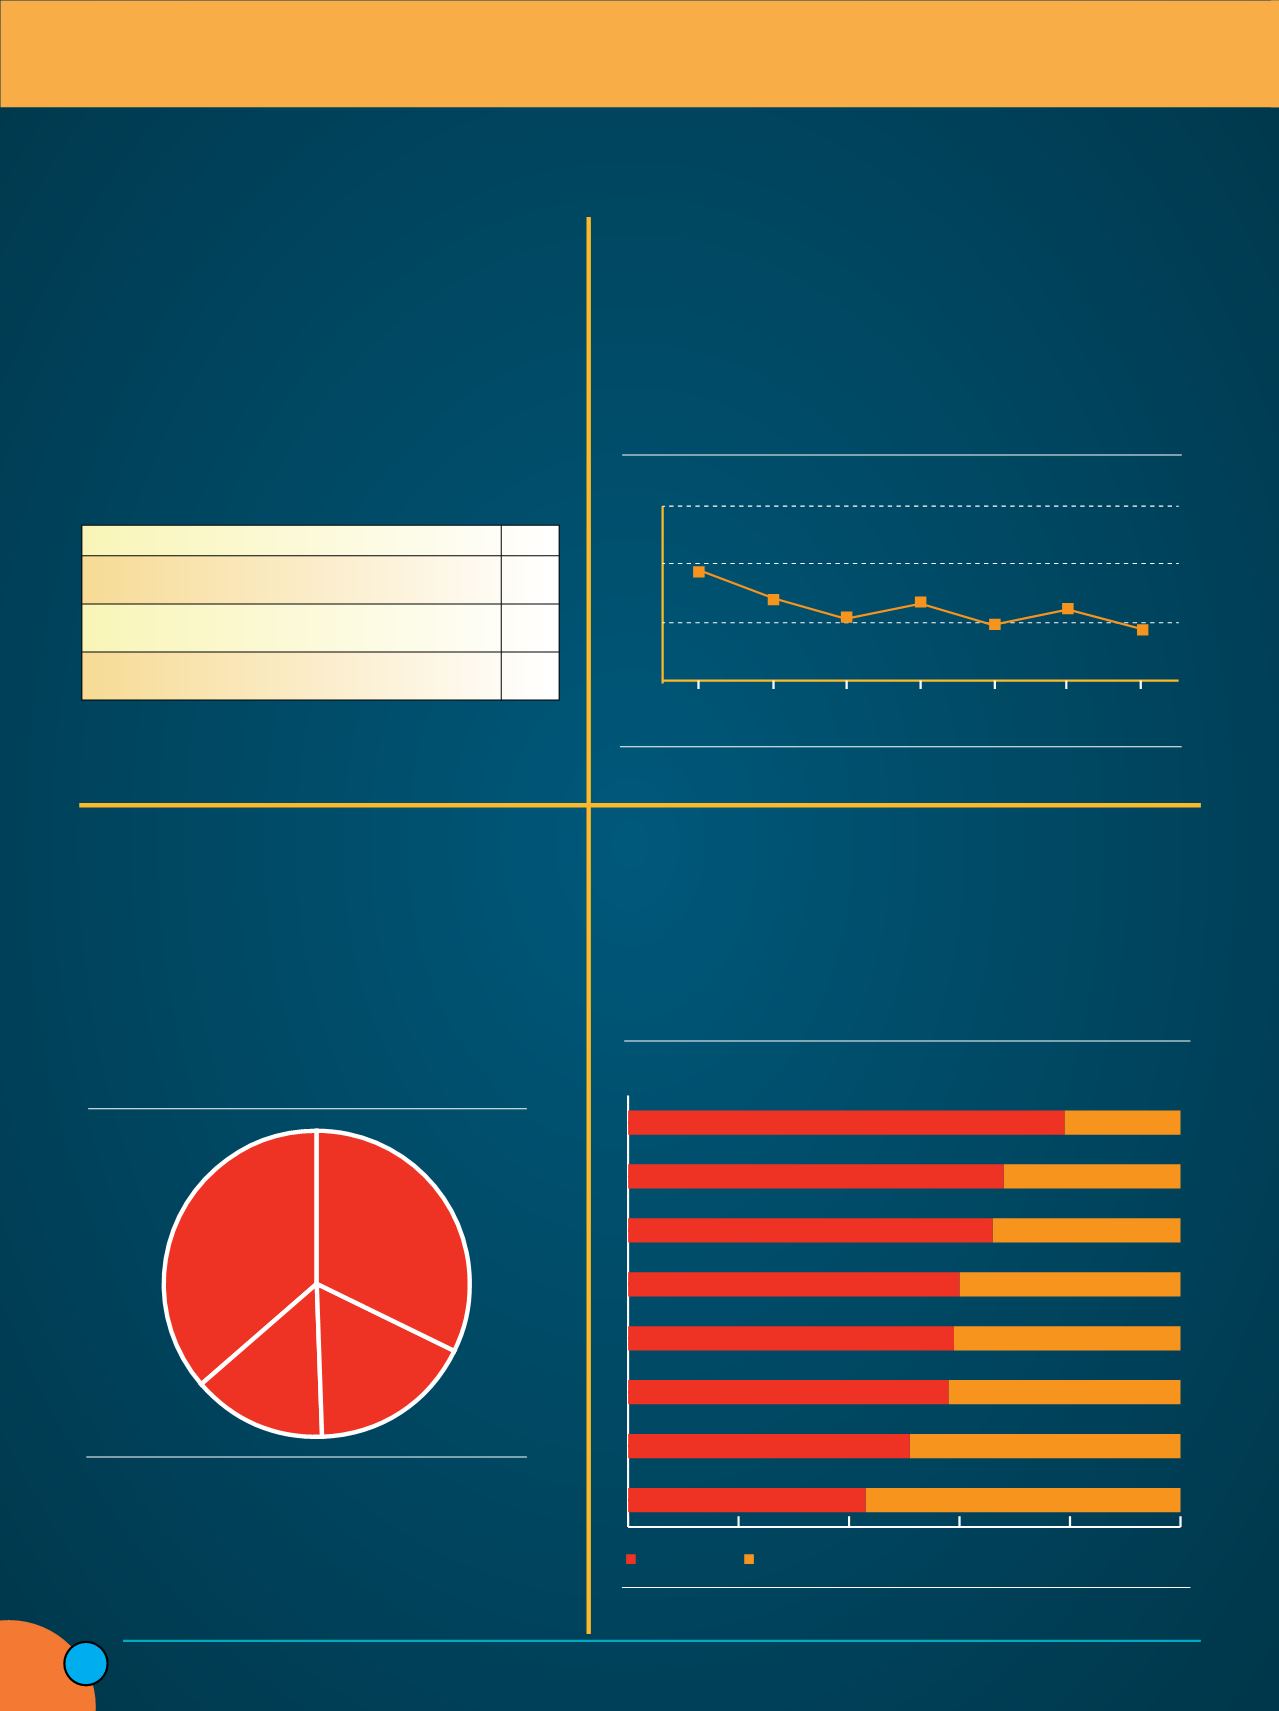
Product Categories that US Teen Internet Users
Prefer to Purchase Digitally vs. In-Store, May 2016
Desktop
32%
Mobile
17%
Both
14%
Don’t use
36%
Food
Health & beauty
Shoes
79%
21%
32%
34%
68%
66%
Future Health and Fitness Monitor Buying
15%
10%
5%
9.3%
7.0%
5.6%
6.8%
4.9%
6.3%
4.5%
0%
Jan
2015
Apr
2015
Percentage of Respondents Who Plan on Buying a Health and Fitness Monitor in the Future
% of respondents
Jul
2015
Oct
2015
Jan
2016
Apr
2016
Jul
2016
Source: 451 Research
US Millennial Internet UsersWho Use
an Ad Blocker, by Device, July 2016
Source: Anatomy Media
of respondents
roduct Categories that US Teen Internet Users
refer to Purchase Digitally vs. In-Store, May 2016
Desktop
32%
Mobile
17%
Both
14%
Don’t use
36%
% of respondents
Extent toWhich a Brand’s Social
Presence Influences US Social
Users’Holiday Purchase Decisio
18 and Up
Source: G/O Digital
A factor,
among other
things
18.9%
Has some influence,
but not overly
important
29.1%
Irrelevant
44.7%
An Important
factor
7.4%
Actions That Make People Follow a
on Social Media
Source: Sprout Social
73.4%
58.8%
51.3%
42.2% 41.5%
Interested in Their
Product/Service
Offered an Incentive
Interested in Promotions
Interested in Their Industr
They’re Entertaining
To Communicate with Bra
Percentage of Responses
Wearable Woes?
Yikes, that was fast. 451 Research’s latest wearable device
trends survey shows demand for health and fitness monitors and
smart watches falling to the lowest levels of the past 18 months.
The 4.5% of consumers who say they plan to buy a health and
fitness tracker is about half the demand seen in January 2015.
Ageless Ad Blocking
Turns out millennials are just as annoyed as
older folks by online ads that block content. Ac-
cording to a recent Anatomy Media survey, two
out of three U.S. millennials use an ad blocker on
a desktop or mobile device. Oh, by the way, you
can’t block magazine ads.
Teen Shoppers
You may not be able to tell it by looki g around the local m ll
on a Friday night, but outside of computers and games, a plurality
of U.S. teenagers still pref r to shop at brick and mortar locations,
according to customer experience marketing company Interactio s.
Greener Pastures
The majority of consumers take green packaging
and sustainable practices into account when choos-
ing where to shop and what to purchase, or at least
they say they do, shows a survey by Dotcom Distribu-
tion, which surveyed more than 500 online shoppers.
One would assume conscious actions are even more
important to outdoor consumers.
Green Attitudes of Online Shoppers
Respondents who say green packaging is important to them 57%
Respondents who have taken green packaging into account
when deciding where to shop
61%
Respondent who have considered an online retailer’s overall
carbon fo tprint
55%
Respondents who have considered the sustainability of supply
chain practices when deciding between brands
64%
Source: Dotcom Distribution
Platform to which US Social
Are Most Likely to Turn for
ping Ideas/Inspiration
Finishers
24 Hour Finish
ederation
ontrol
ssues
nning
tising
takes
0% 5% 10% 15% 20% 25%
37.9%
31.6%
18.8%
Oka
Altra
Brooks
Hoka
Altra
24.3%
26%
17%
9.4%
20.4%
72
47
25
21
15%
10%
5%
9.3%
7.0%
5.6%
6.8%
4.9%
6.3%
4.5%
0%
Jan
2015
Apr
2015
Percentage of Respondents Who Plan on Buying a Health and Fitness Monitor in the Future
% of respondents
Jul
2015
Oct
2015
Jan
2016
Apr
2016
Jul
2016
Source: 451 Research
US Millennial Internet UsersWho Use
an Ad Blocker, by Device, July 2016
S urce: Anatomy Media
% of respondents
Product Categories that US Teen Internet Users
Prefer to Purchase Digitally vs. In-Store, May 2016
Source: Interactions, eMarketer
Desktop
32%
Mobile
17%
Both
14%
Don’t use
36%
Food
Health & beauty
Shoes
Mobile phones
Jewelry
Clothing
Computers
Games
In-store
Digitally
79%
21%
32%
34%
40%
41%
42%
49%
57
68%
66%
60%
59%
58%
51%
43%
Inside
Outdoor
|
Fall
2016
8