


 44 / 56

Inside
Outdoor
|
Fall
2015
44
kenneth j hamilton / Rumney, nh
nanospikes is a trademark of kahtoola inc.
Not that a slower opening weekend
ruined retailers’ holidays. When all
was said and done, sales were rather
healthy, with growth slightly outpacing
long-term trends. Rather, consumers
say they are starting earlier, to avoid
the rush, as well as shopping later into
the season, to take advantage of anti
cipated late-season discounting. In other
words, there may need to be some
re-assessment as to what counts
as “holiday sales,” as Christmas
creeps further back toward Hal-
loween and onto New Year’s.
As for 2015 expectations, the
prognosticators’ sales growth predic-
tions range anywhere from 2.4 per-
cent (ShopperTrak) to 3.3 percent
(International Council of Shopping
Centers) to just more than 5 percent
(Deloitte), pretty much in range with
the predictions and results we have
seen since 2008. Also like most
other years, these analysts point to
variables such as gas prices, stock
market indices, wage stagnation
and even a “government shutdown”
(yes, again). One such firm, however,
relies less on these broad economic
indicators, insisting that the best
gauge of what consumers will spend
during the holidays is what they’ve
spent so far that year.
Looking at historical retail sales data
from 1992 to present from the Depart-
ment of Commerce, AlixPartners says
it can reasonably predict holiday sales
based on current-year sales through
the end of back-to-school. Excluding
2008 (what AlixPartners calls a “Black
Swan event”), sales through the back-
to-school period have consistently ac-
counted for between 65.5 percent and
66.8 percent of annual sales. In the last
five years, that range has tightened,
averaging between 66.2 percent and
66.4 percent of annual sales – result-
ing in a miniscule standard deviation.
By this measure, AlixPartners predicts
holiday sales will increase 2.8 percent
to 3.4 percent in 2015.
Breaking out sporting goods sales
specifically, sales through August 2015
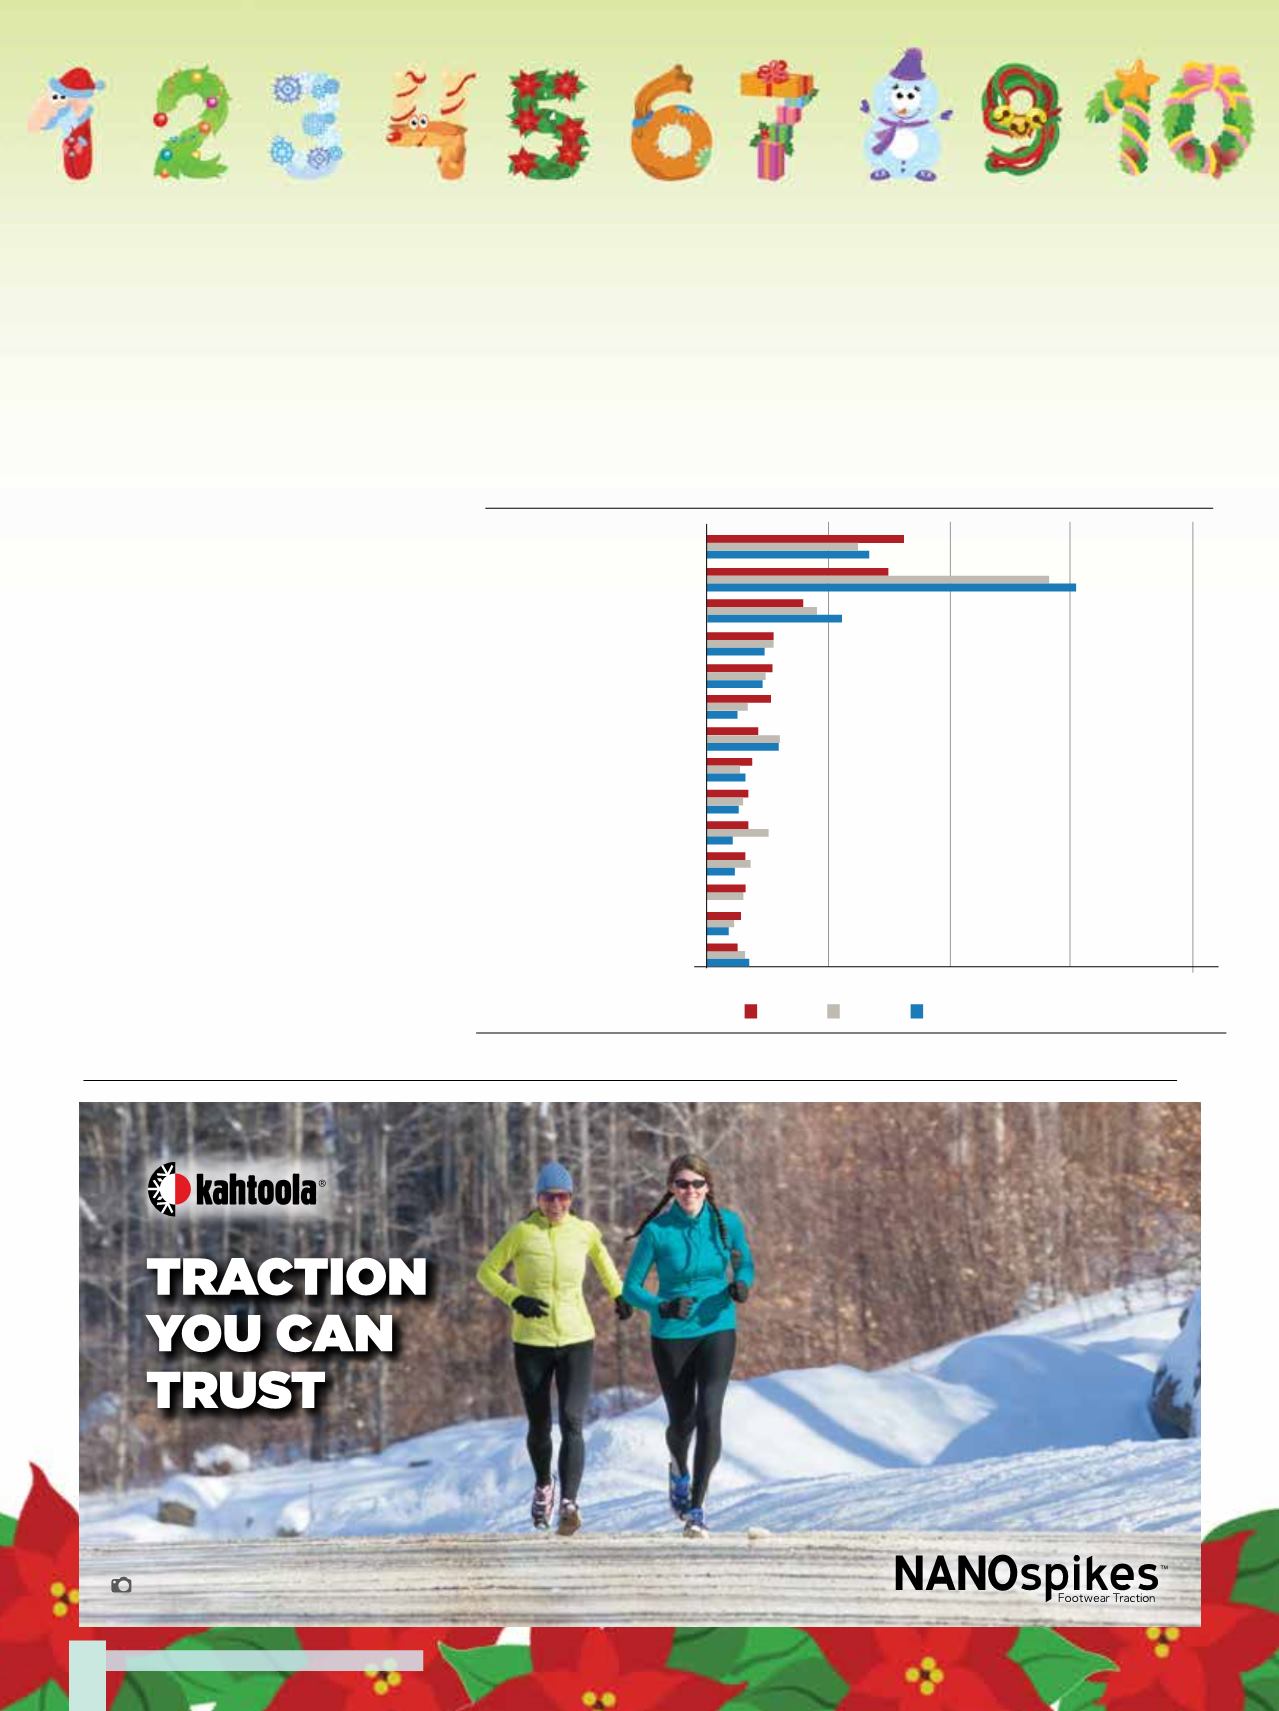
What are the top three ways you became aware of a shopping Web site this holiday?
Source: Prosper Insights & Analytics;
Shop.orgPearl
Izumi
Salomon
Montrail
Altra
32.4%
30.0%
15.9%
10.6%
10.5%
10.4%
8.3%
7.4%
6.7%
6.6%
6.2%
6.1%
5.5%
4.9%
Shoe Brand - All Finishers
Shoe Brand - Sub 24 Hour Finish
5.7%
8.8%
Hoka
Brooks
34.5%
19.6%
Hoka
35.7%
9.3%
16.5%
New
Balance
8.3%
Source: AixPar ners; US Census Bureau, Seasonally Adjusted Retail Sales (Excludes Motor Vehicles,
Gas, Food Services & Drinking Places)
0
500,000
Email from the retailer
Shopped from the Web site before
Used search engine results
(e.g. Google, Yahoo!, MSN, AOL, other)
Online ad
Recommendation from friend,
family member or colleague
Deal of the day sites (e.g. Group. LivingSocial)
Shopped in the physical (offline) store before
Catalogs
Print adverting
TV advertising
Go to a bookmark that I have set
Social netwokring sites
(e.g. Facebook, Twitter, Pinterest, etc.)
Email from another site/not retailer
Typing store’s URL or
web address into my Web browser
Through BTS
Sept - Dec Sales
Holiday Sales
1,000,000
1,500,000
2,000,000
2,500,000
3.2%
-3.9%
0.1%
2.9% 3.4%
4.0%
2.0%
0.0%
-2.0%
-4.0%
-6.0%
Sales ($M)
YOY Holiday Sales %
2005
2006
2007
2008
2009
2010
2011
2012
2013
2014
2015
2014
2013
2012
0%
20%
40%
60%
80%
67
6
6
38
32
18
17
11 11
Brooks
8.3%