


 8 / 68

Numbers Worth Noting
DATA POINTS
By
Martin
Vilaboy
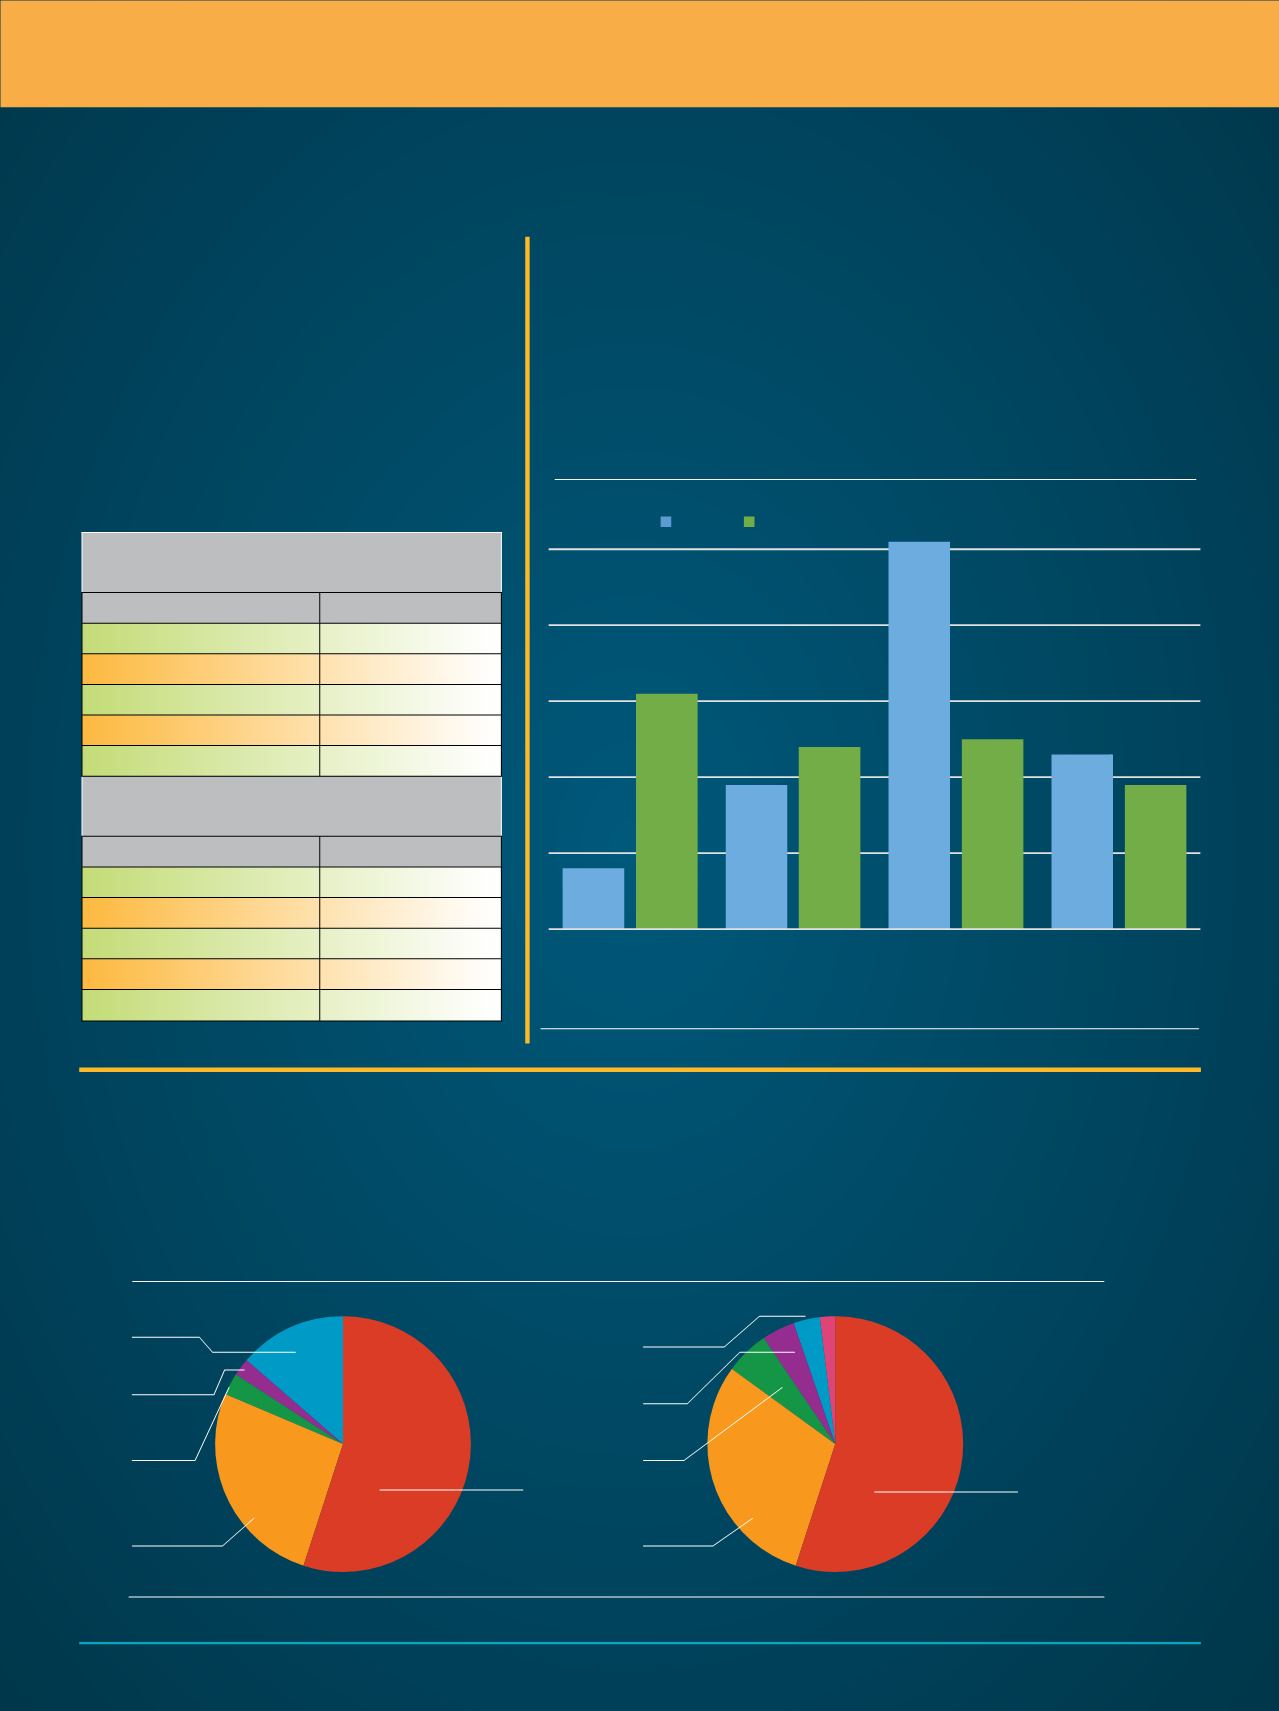
Lighting of Choice among
2016WSER Finishes
Lighting of Choice among
2015WSER Finishers
Source: Western States 100-Mile Endurance Run Runner Survey
Usage ofWireless Network in Stores
Other
13.6%
Princeton
2.2%
Fenix
2.6%
Black
Diamond
26.5%
Other
5.7%
Princeton
3.5%
Fenix
4%
Black
Diamond
30%
Petzl
55.1%
Petzl
55.1%
150
125
68
13
9 8
72
37
Source: Western States 100-Mile Endurance Run Runner Survey
Usage ofWireless Network in Stores
Source: Retail Systems Research
Outdoor Participation by Age
30 31 32 33 34
A FAMILY
Other
13.6%
Princeton
2.2%
Fenix
2.6%
Black
Diamond
26.5%
Other
5.7%
Princeton
3.5%
Fenix
4%
Black
Diamond
30%
Petzl
55.1%
8 12 16
20
21
22
23
24
25
26
27
28
29
30
6 61 66
60 66
y Age
150
68
13
9
72
37
No wireless network
available in store
Wireless available
only for receiving
and other inventory
control related tasks
Age 6-12 Age 13-17 Age 18-24 Age 25-44
Age 45+
Wireless available
throughout the store
for performance
management, POS &
product related tasks
Wireless available
for customers
2016 2015
80%
70%
60%
50%
40%
30%
2006 2007 2008 2009 2010 2011 2012 2013 2014 2
8%
31%
19%
25%
51%
25%
23%
19%
Shedding Light on Ultra-Runners
Petzl continues its dominance as the lighting brand of choice among ultra-runners who finished the 2016 Western
States 100-Mile Endurance run, grabbing more than half of that market share. Meanwhile, smaller and upstart brands
in the “other” category made some gains on other perennial brand leaders Black Diamond, Fenix and Princeton Tec.
Is there Wi-Fi?
It appears retailers are finally coming to grips with the reality that
in-store Wi-Fi is a cost of business. “We cannot overstate how impor-
tant this change is,” say analysts at Retail System Research, which
presented the findings. “If retailers have any chance of embracing the
future, connectivity in their stores for both employees and customers
is nothing less than a basic requirement.” We whole-heartedly agree.
Social Stream Scream
The number of social messages retailers
receive continues on an upward trajectory, with
the average retailer receiving approximately
30% more messages in the fourth quarter
of 2016 versus Q4 2015, show figures from
Sprout Social. What’s more, well more than half
of social messages will require action, with Q4
2016 expected to see a 15% annual increase
in social messages that warranted a response.
Average Number of Messages Received
By Retailers
Quarter
Messages
Q4, 2015
2,422
Q1, 2016
2,062
Q2
2,232
Q3
2,731
Q4 (projected)
3,140
Average Number of Messages in Need
of Response
Quarter
Messages
Q4, 2015
1,306
Q1, 2016
1,075
Q2
1,149
Q3
1,535
Q4 (projected)
1,780
Source: Sprout Social, November 2016
Inside
Outdoor
|
Winter
2017
8